Last Updated on April 22, 2023 by Uncle Pat Ugwu
Are you looking for a way to make complex ideas and concepts easier to understand for your students or clients? Infographics might be the answer. Infographics are visual representations of data or information that are designed to communicate complex ideas in a simple and easy-to-understand way.
They have become increasingly popular in education and business, as they can be useful tools for explaining complex concepts and ideas to a wide audience. In this blog post on infographics pros and cons, we’ll explore the pros and cons of using infographics and provide tips for creating effective ones.
If you’re a teacher looking for a new way to engage your students or a business owner looking to increase engagement with your clients, you’ll find valuable information in this post about how infographics can benefit you.
What is Infographics?
Before diving into the infographics pros and cons, it’s important to understand what they are and how they have evolved over time. There are different types of infographics, that will help you decide how to create your own infographics.
Definition of Infographics
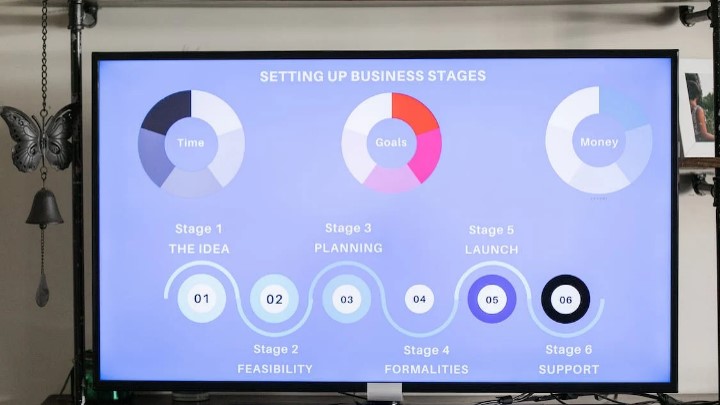
Infographics are visual representations of data or information, often used to communicate complex ideas in a simple and easy-to-understand way. They can take many forms, including flowcharts, diagrams, maps, and data visualizations.
Brief History of Infographics
Infographics have a long history, with the earliest known example dating back to the 18th century. Over time, they have been used in a variety of settings, including marketing, education, and journalism. Today, infographics are more popular than ever, with the rise of social media and other online platforms making it easier to share and distribute them widely. Also learn about social media security.
Examples of Infographics
There are many different types of infographics, including:
- Flowcharts: These graphics show the steps in a process or decision-making tree.
- Diagrams: These graphics show the relationships between different parts or concepts.
- Maps: These graphics show geographical information or locations.
- Data visualizations: These graphics show statistical data in a visual format, such as bar charts or pie charts.
With this background information in mind, let’s take a closer look at the infographics pros and cons.
Pros of using infographics
Infographics are visual representations of data or information, often used to communicate complex ideas in a simple and easy-to-understand way. While there are potential drawbacks to using infographics, there are also many pros to consider. Here are some of the key benefits of using infographics:
1. Visually appealing
Infographics are often more visually appealing than text-based content, which can make them more engaging for readers. They can include a variety of elements such as charts, diagrams, and images, which can help to illustrate concepts and ideas in a clear and visually appealing way.
2. Can convey complex information in an easy-to-understand format
One of the main benefits of infographics is their ability to convey complex information in a way that is easy to understand. By using visual elements such as charts and diagrams, infographics can help to simplify and explain complex ideas, making them more accessible to a wider audience.
3. Can be shared easily on social media and other platforms
Infographics are highly shareable, which can be a big advantage if you want to reach a wider audience. They can be easily shared on social media platforms and other websites, which can help to increase traffic to your site.
4. Can increase website traffic and engagement
Because infographics are highly shareable, they can be an effective way to increase traffic to your site. They can also help to increase engagement, as readers may be more likely to spend more time on your site if they are reading an infographic rather than just text.
Infographics can be a powerful tool for conveying complex information in a visually appealing and easy-to-understand way. While they may take more time and effort to create than text-based content, they can be a valuable asset for increasing traffic and engagement on your website.
Cons of Using Infographics
While there are many benefits to using infographics, there are also some potential drawbacks to consider. Here are some of the main cons of using infographics:
1. Can be time-consuming to create
Creating an infographic can take a significant amount of time and effort, especially if you are starting from scratch. This can be a drawback if you are working on a tight deadline or have limited resources.
2. May require design skills or hiring a designer
Depending on the complexity of the infographic, you may need to have some design skills or hire a designer to create it. This can add additional time and cost to the process.
3. May not be accessible to all users
Infographics may not be accessible to all users, particularly those with visual impairments. It’s important to consider accessibility when creating infographics and ensure that the information is presented in a way that is accessible to all users.
4. Can be oversimplified, leading to misunderstanding of the information presented
While infographics can be an effective way to convey complex information, they can also be oversimplified, leading to a misunderstanding of the information presented. It’s important to strike a balance between simplification and accuracy when creating infographics.
It’s important to carefully weigh the pros and cons of using infographics before deciding if they are the right choice for your project. While they can be a powerful tool for communicating complex ideas, they may not be the best choice in all cases.
Tips for Creating Effective Infographics
If you decide to use infographics as a way to communicate complex information, it’s important to create ones that are effective and engaging. Here are some tips for creating effective infographics:
1. Use clear and concise language
Infographics should be easy to understand, so it’s important to use clear and concise language. Avoid using jargon or technical terms unless absolutely necessary, and consider using headings and subheadings to break up the text and make it easier to read.
2. Choose appropriate graphics and layout
The graphics and layout you choose can have a big impact on the effectiveness of your infographic. Choose graphics that are relevant to the information you are presenting, and use a layout that is easy to follow.
3. Consider the intended audience and purpose of the infographic
It’s important to consider the intended audience and purpose of your infographic when creating it. This will help you choose the right graphics, layout, and language to use.
4. Use credible sources and fact-check information
Infographics should be based on accurate and reliable information, so it’s important to use credible sources and fact-check all of the information you include. This will help ensure that your infographic is accurate and trustworthy.
As we round off this post on infographics pros and cons, it is crucial to note that while there are potential drawbacks to using infographics, they can be a powerful tool for communicating complex ideas in a simple and easy-to-understand way.
Final Thoughts
Infographics can be a useful tool for educators looking to communicate complex ideas in a simple and easy-to-understand way. They can be particularly useful for visual learners, who may find it easier to understand information when it is presented in a visual format.
However, it’s important to consider the potential drawbacks of using infographics in education as well. They can be time-consuming to create, may not be accessible to all students (particularly those with visual impairments), and may oversimplify complex topics. There are also many importance of technology in education. To ensure that infographics are effective in education, it’s important to follow best practices for creating them.


